
The Housing Crisis: A Solidarist Perspective
Part 1: What Mainstream Economists Get Wrong

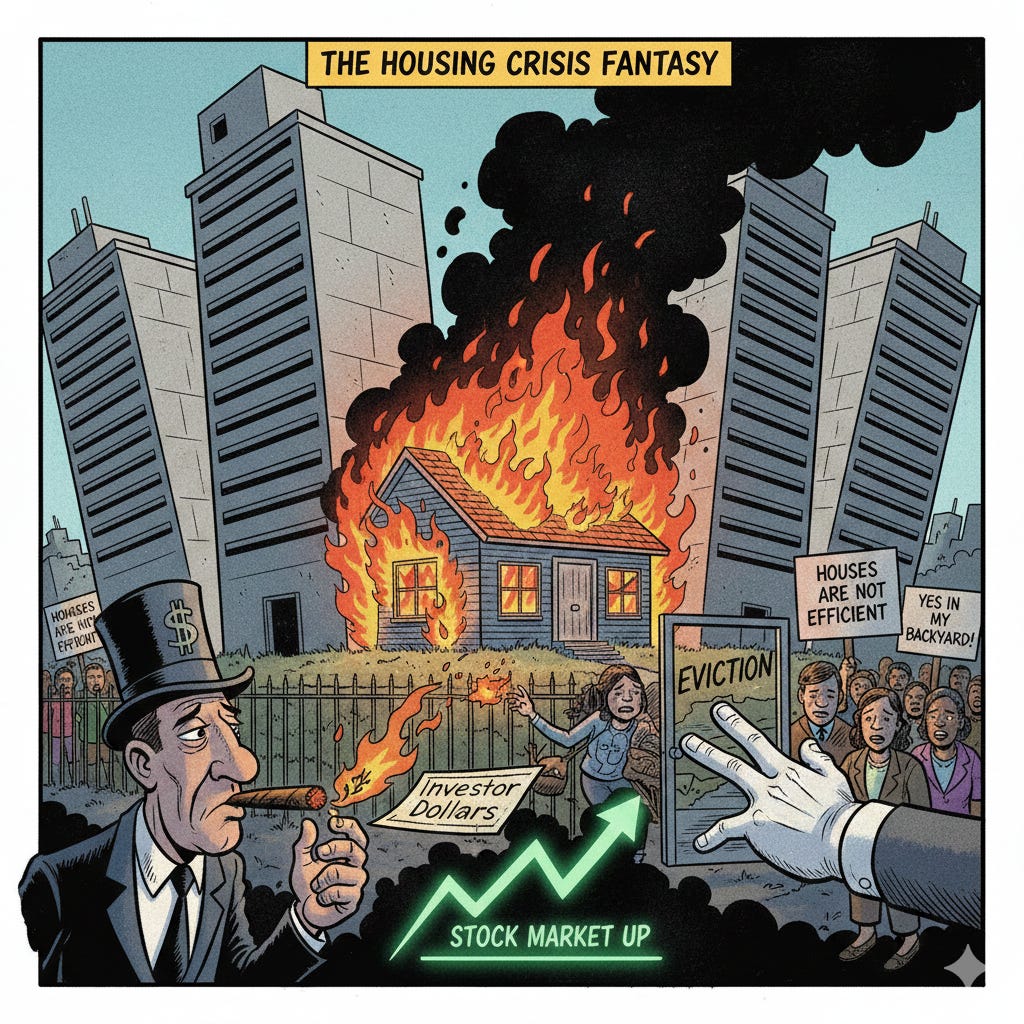
The Mainstream Cause: Supply
Mainstream economists and real estate professionals have essentially united in informing the public that the cause of the unaffordable housing market is a supply of homes that is way too low and insufficient to meet demand. The solution they then propose is to build more homes - typically multifamily units - in order to increase the level of supply to meet the demand and thereby solve the crisis. These folk are known as YIMBYs - “Yes In My Backyard” - and advocate for drastic zoning reform and increasing (typically multifamily) development. They also claim that homelessness is caused in a huge part because there just is not enough housing for everyone. This logic is built on efficiency, mainstream economic dynamics, and a simplistic view of markets: building more will lead to decreases in prices and rents, and the crisis will be resolved. There are some housing economists who understand - from their years of experience - that there are other factors related to financial markets such as interest rates and general credit conditions, however this is not the predominant view among YIMBY activists and associated economists.
Centered around the policy discussions is usually the definition of supply and demand. For the most part, when mainstream economists and YIMBYs discuss demand, this almost always refers to the number of buyers in the market. However, supply typically takes on one of two definitions for them: (1.) the number of sellers/houses for sale in the market at a given time (market supply), or (2.) the physical inventory of housing (housing stock). The idea is that building more units will increase supply - under both definitions - and therefore bring prices down.
The reasoning is premised on simple supply and demand curves that one could expect to find in an introductory economics class:
Increasing the supply causes the prices to come down since, in these models, “equilibrium” prices are always determined by the intersection of supply and demand.
If this simplistic analysis is true, we would expect to see the following in the data:
when,
1.) demand is high and supply is low → prices ↑
2.) demand is low and supply is high → prices ↓
Furthermore, if there truly is a housing shortage, we would also expect to see the physical housing inventory failing to keep pace with population growth.
Well, what does the data show?
Why The Mainstream is Wrong
Economics
Using data from Redfin.com, I created a chart that shows how the number of suppliers and demanders has shifted over time since 2019:
As expected, the number of buyers surpassed the number of sellers in 2020-2022. Since 2024, however, the number of sellers has greatly surpassed the number of buyers, and the gap appears to be widening. According to the YIMBY and housing economists, this should be great news for home buyers, right? That must mean prices have dropped substantially! Let’s see how much they have dropped since the beginning of 2024:
Since January of 2024, prices have actually increased. It seems that having a surplus of sellers compared to buyers is not the death knell to the affordability crisis that many had hoped. Also, if market frictions prevent current supply from lowering prices, as some might argue, this raises a critical question: why would additional supply overcome these same frictions?
Furthermore, the YIMBYs would most likely object to the fact that this national-level data obscures geographic variation, and that the story should change if we analyzed individual housing markets alone since prices may rise in some regions while supply grows in other regions. To address this, I found data on the Charlotte, NC metropolitan area and the results are essentially the same. First the market:
And then the increase in prices since 2024 (despite the huge and growing gap between sellers and buyers):
Housing Stock Arguments
“But wait,” you might say, “That is only looking at the first definition of supply that you provided. There are not enough housing units for the population: it has been decreasing over this time period!”
That’s where it gets more interesting. If you look at the actual housing stock growth since late 2020 and compare it to the growth in the population level1, you actually get a remarkable finding:
Since 2020, the growth in the housing inventory has surpassed the growth in the population level. How could that be if the YIMBYs are correct?
Furthermore, we would expect to see a “shortage” in the data. The magnitude of the “shortage” can be gauged by assessing the difference between the total housing inventory and the number of households2. This would show the total number of housing units in the country that are not being occupied: an approximation of the gross vacant stock.
If the physical housing supply “shortage” did exist, this number would be close to zero or closing rapidly. Instead, it remains above 14 million! This undermines the idea that there are not enough housing units for the population level and households more generally.
A Caveat
Maintaining a healthy supply of housing is important for the national economy. This post is not meant to attempt to argue that supply is not important, but rather provide evidence contrary to the mainstream narrative that the drastic cost of obtaining housing is all due to some market or physical shortage. It is clear that something more complex is occurring.
The True Cause…
Now that I have offered empirical evidence contrary to the mainstream view, I encourage you to subscribe and stay tuned for the second post, where I will discuss the true cause of the housing crisis that transcends basic supply and demand. This revolves around the fact that housing is not a commodity like beans or corn, but closer to an asset. As such, prices will depend not only on physical units built or available on the market at a given time, but on other factors including credit conditions, investor activity, and the increased level of financialization over time.
Population level is used since this is the only part of the population that is actually in the market / can purchase or rent a house. The definition of population level, as per the Bureau of Labor Statistics, is “the civilian non-institutional population, which includes people age 16 and older living in the 50 states and the District of Columbia who are not in the military or in an institution like a prison or a nursing home.”
Number of households is defined as all people who occupy a housing unit as their usual place of residence.